JavaScript charting libraries are the best way to represent your website data and reports for visualizing data that people will like to see. If you have a long database and need to display in a text format like old method then its very difficult to understand to any one. To enhance this long data online in any website you can use JavaScript chart library which will make your website report user friendly and every one like to visit your website.
Today I am going to write various free JavaScript chart library with support of different type interactive graphs like Line Chart, Bar Chart, Polar Area Chart, Radar Chart, Bubble Chart, Scales, Pie & Doughnut Charts, Trading Chart etc .Any one can use the JavaScript charts and graphs for their web sites and applications most of the below are free and open source. If you are jquery plugin lover then you may be interested to see older post free JQuery plugins for animation.
It is easy for developers to display professional quality different type of charts for report in their applications. Actually there are lots of JavaScript charting library available over the internet and providing powerful features. Whether you are evaluating new Network Automation or security devices or looking to lower the TCO of your existing infrastructure, with Indeni Insight you can benchmark your performance across your peers and make informed decisions.
1) Chart JS

Chart.js is a opensource Html5 library to create the charts on website page. Chart.js provides two different builds that are available for your use. The Chart.js and Chart.min.js files include Chart.js and the accompanying color parsing library. Chart.js allow it easy to create chart with many options that can help you customize your charts with scales, tool tips, labels, colors, custom actions. Using Chart.js we can create the Line Chart, Bar Chart, Radar Chart, Polar Area Chart, Pie & Doughnut Charts, Bubble Chart, Scales.
View Link : www.Chart.js
2) jqplot
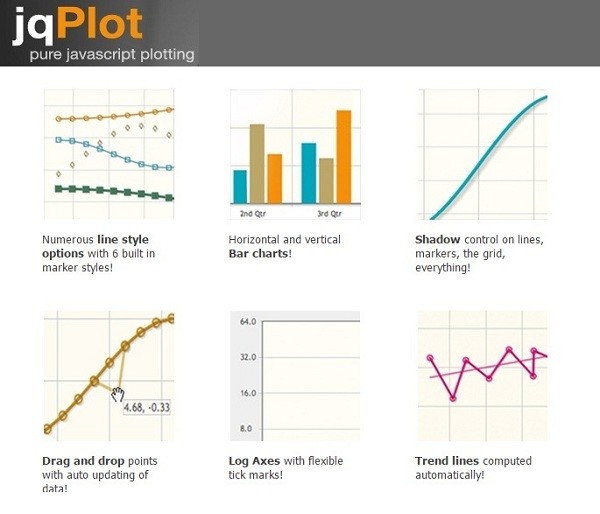
jqPlot is also an open source project licensed under the MIT and GPL version 2 licenses. You can use it free to and can be best suits your project. jqPlot is a pure JavaScript Library with many example of charts available on its website. jqPlot is a plotting and charting plugin for the jQuery JavaScript framework and jqPlot produces nice js chart like line, bar and pie charts. One of the most good features is the animated charts and it can be very useful to attract the more customer specially when display different analytic reports on this type of charts.
View Link : www.jqplot.com
3) RGraph
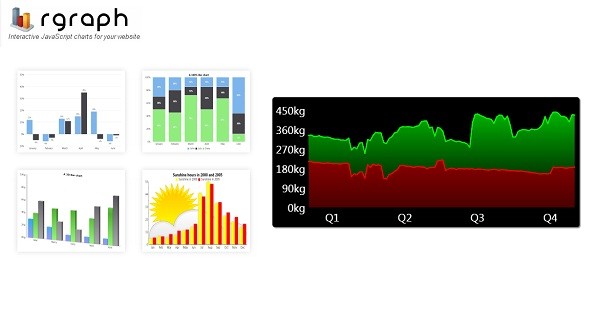
RGraph is an Open Source JavaScript charts library and we can create more than 50 different kinds of charts using RGraph js charts. It purely uses JavaScript and HTML5 canvas to create Graph. RGraph is very quick, attractive js libray and easy to use. RGraph is free for commercial use and supports the canvas element for desktop and mobile support. It’s an excellent js library that allows you to create charts and dashboards for wide range of devices.
View Link : www.rgraph.net
4) Dygraphs
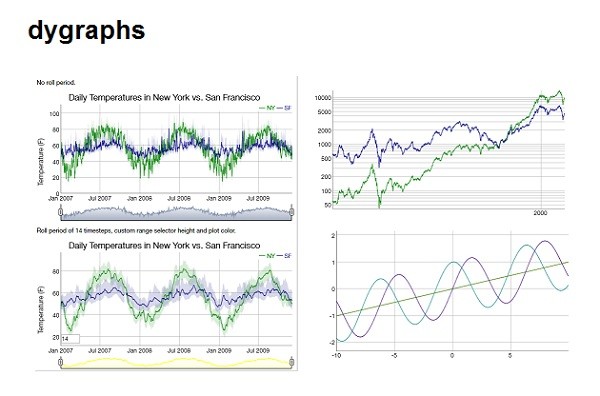
Dygraphs is a fast and flexible open source JavaScript charting library. Dygraphs allows users to explore and interpret dense data sets. It Handles very huge data sets and plots millions of points without getting bogged down.
Dygraphs Interactive is out of the box, zoom, pan and mouse over are on by default. Dygraphs JavaScript chart library is highly compatible and it works in all major browsers (including IE8). It allow even pinch to zoom on mobile and tablet devices!
View Link : www.dygraphs.com
5) Elycharts
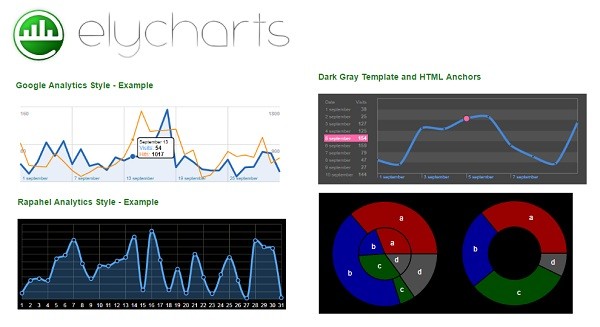
Elycharts is the ultimate JavaScript charting library with various type of support chart like pie chart, bar chart, line chart, Donuts chart, Multiple series pie chart etc. Elycharts 100% pure JavaScript and it doesn’t require any client side plugin. Elycharts available open-source and free for personal and commercial use. Elycharts comes with Highly customizable with a simple configuration options.
View Link : www.elycharts.com
6) Flot
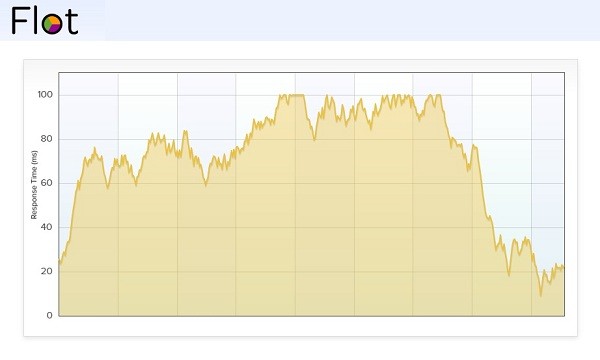
Flot is a pure JavaScript plotting and attractive library for jQuery. Flot focus on simple usage and it looks are attractive comes with interactive features.
View Link : www.flotcharts.org
7) morris.js
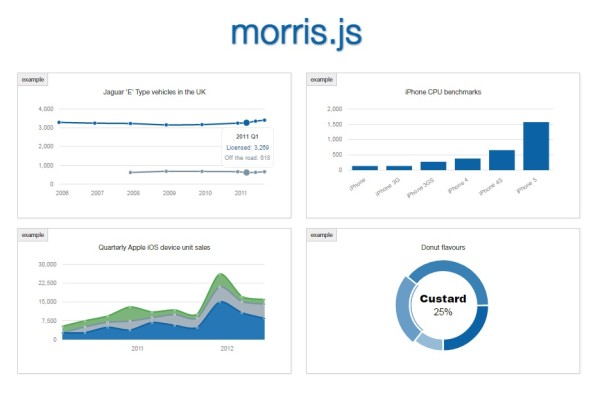
Morris js is JavaScript chart library and available free for use. It supports the Line & Area Charts, Donuts Charts, Bar Charts. Chartes created on Morris js will be very good looking and attractive.
View Link : www.morrisjs.github.io/morris.js
8) jChartFX
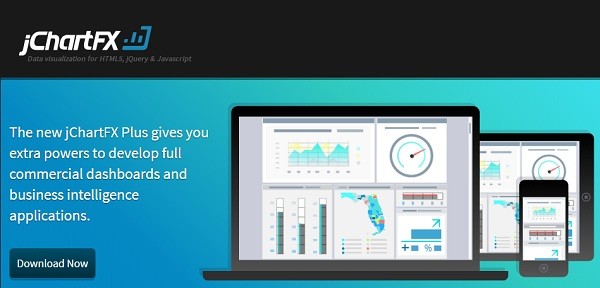
jChartFX is Free js chart library for personal use. jChartFX library is data visualization for HTML5, jQuery and Javascript. The leading charting tool for HTML5, jQuery and Javascript developers is absolutely FREE.
You can integrate and deploy jChartFX on your personal and internal web sites.
View Link : www.jchartfx.com


